Community Indicators for Your Community

Real, lasting community change is built around knowing where you are, where you want to be, and whether your efforts are making a difference. Indicators are a necessary ingredient for sustainable change. And the process of selecting community indicators -- who chooses, how they choose, what they choose -- is as important as the data you select.

This is an archive of thoughts I had about indicators and the community indicators movement. Some of the thinking is outdated, and many of the links may have broken over time.

Showing posts with label National Association of Planning Councils. Show all posts

Saturday, April 17, 2010

NAPC Conference, Day Two

Last night at the NAPC conference we had a nice reception where Irv Katz, from the National Human Services Assembly, addressed us on some of the critical issues they're addressing -- you can see what's on their policy agenda here: National Assembly

After a series of participant introductions this morning (fascinating work being done around the country and Canada by members), the focus turned to where we are now economically. Heidi Shierholz of the Economic Policy Institute addressed us.

Heidi -- "The Recession is Over -- but over for whom?"

In past recessions, quick bounce-back in employment after the recession -- until the last two recessions. In early  1990s, "jobless recovery" term was coined. In early 2000s, recession ended with a 'job-loss recovery." That's what we're facing now -- jobless (or perhaps job-loss) recovery. So the key benchmark isn't GDP growth but unemployment rate -- now 9.7 nationally, will likely continue to rise through the end of thisyear and will reach its peak then --we're not going to feel like a recovery util next year.

Now we're in the calm after the storm, looking at the damage in the labor market. We've lost over 8 million jobs, but population rising -- so we need to add on the order of 100,000 jobs a month just to keep unemployment stable. Overall, we're really down 11 million jobs (job losses + labor market growth) to get to pre-recession unemployment levels.

Layoffs are now down to pre-recession levels -- that's good. But hiring has not picked up -- that's bad. In fact, the peak of the business cycle in 2007 is still worse than the pre-recession late 1990s -- we hit this current recession in the worst shape with the least cushion of any prior recession (post-Depression).

After recession of the 1990s was over, had year and a half of increasing unemployment before it started to improve. The same thing in the early 2000s. We're seeing the same thing now. (And that's not counting the discouraged workers!)

In fact, when we add in the unemployed, involuntary part-time, and marginally employed workers, we're up to 17 percent underemployment -- up from around 7 in 2000. Largest increase isn't in discouraged workers  (which is still a big increase) but in involuntary part-timers. "The huge involuntary part-time is a threat to reducing unemployment." Employers who cut hours, not workers, to cut costs, means that employers can increase production by adding hours, not workers, further delaying any new hiring. And when jobs do pick up, 3 million more people will enter into the labor market if the labor market participation returns to normal -- meaning job growth won't move the dial on unemployment rate for a while.

The overall unemployment rate masks other issues. Men have been harder hit than women in the recession. Racial and ethnic minorities hit harder than whites. People with less education getting hit harder too. Young workers hit much harder -- nearly 20 percent of 16 to 24 unemployed. Older workers, on the other hand, have been slammed on the wealth  front (housing value, retirement funds), while younger workers are slammed in the labor market.

In labor market, the chart seems to show that best case scenario is older white college-educated woman -- hardest hit is young black male without high school education.

This summer people leaving school now face the worst labor market in 70 years. (Sucks to be born in the 80's, and not just because of the music and hair!) We're also looking at a 8-10 year swath of long-term unemployment for younger people. Without summer jobs, what are young people going to do with their time? School enrollment going up, but not matching the growth in non-labor market participation. Growth in Nene's -- not enrolled, not employed.

Seeing increased labor market participation among older workers -- because of attack on wealth, people not retiring. Stock market improvement might help unemployment rate.

Long-term unemployment recession -- shattering every record for length of unemployment. We haven't reached the peak of unemployment in the 80s recession, but the length of unemployment is unprecedented. Number of job seekers per  job opening is huge -- 5.5 people per job. So extending unemployment insurance doesn't keep people from taking jobs -- there aren't jobs for them to take.

"The worst recession since the Great Depression? Absolutely."

The recession started out super-mild, until Lehman Brothers -- the collapse of the financial market accelerated the recession to unbelievable levels -- at one point losing 700,000 jobs a month. Also twice as many people in the country now since the Great Depression -- principle of large numbers say the impacts in places with the large numbers affected has an exponential effect.

What's in store? We do not have to settle for permanently high unemployment. But the short and medium term are going to be ugly. Recovery will take a long time. To fill the 11 million jobs gap, we would need 1 million new jobs a month to fill it in 1 year. To fill in 5 years, we would need nearly 300,000 jobs a month (every month!) The latest "really good news" had 167,000 new jobs in a month. Projections: 10.1 unemployment averaged this year, 9.5 next year, 8 in 2012, 2013 6.3 percent unemployment -- still worse than the worst year of the early 2000s recession.

Again, communities are facing long-term ugly unemployment and it could take much longer to fill the jobs gap. Projections still based on people behaving the same way they did before the recession -- but people aren't behaving the same way, and not retiring when projected because they can't afford to. And social security is in trouble.

Clear relationship between unemployment rates and family income. Real family middle income has been hammered. The 2000s recovery never got family income back to pre-recession levels, and now with this recession even in 2015 the typical family income will not get back to where it was at the low point of the early 2000s recession, let alone as high as it was in the pre-2000s recession time. There's no upward pressure on wage growth, and won't be for a while.

Overall poverty rate around 15 percent -- not dropping down to turn-of-the century rates by 2015. And  for kids it's worse, and for racial and ethnic minorities worse -- about 1/3 black poverty rate now, perhaps down to 24 percent in 2015.

So what should be done? Communities are going to be suffering a lot for at least the next five years -- things will get better over time. National level answer? Heidi says it's more stimulus dollars, and much more. Real, measurable GDP change with the Recovery Act -- estimated 2.5 million more job losses without it, is on track to reach 3-4 million jobs, just wasn't on the right scope of this crisis. Really need something on the scope of $1.5 trillion.

Can we afford it? What about the deficit? 2 time horizons: short-term and long-term. A key way to bring the deficit down is to deficit-spend to create jobs. What has added to the deficit? Increases in the deficit: Bank bailout: $184 billion (TARP) about 15 percent increase in deficit. 15 percent ($181 billion) is stimulus. $841 billion is the recession -- high unemployment, low income, business loss, resulting in fewer taxes paid. So deficit-spend to create taxpayers is the long-term solution to deal with the deficit, according to Heidi Shierholz.

We need to bail out state and local governments. The most job bang for the buck is state fiscal relief. Because states must balance the budget, they have to either raise taxes or cut services, and both of them drain the economy. National stimulus packages would otherwise just fight against "50 Herbert Hoovers" at the state level counterbalancing economic stimulus efforts with economic drains.

"This recession, make no mistake, was the bursting of the housing bubble -- the bursting of an $8 trillion housing bubble is what creates something like this." And the roots of the problems go back through multiple political administrations.

(Then we got talking about the intersection of economics and politics, and folks got really, really depressed. I won't even go there.)

Heidi's presentation will be available at www.communityplanning.org. For those of us at the conference, the presentation challenges us to re-examine what community planning and community-based work looks like. For those who like economic indicators, check out the charts in Heidi's presentation and think about the economic indicators you might be using in your community to monitor these changes -- and how you might best tell the story of the unprecedented impacts of this recession.

ETA: Here's Heidi's presentation: click here

Read more ...

NAPC Conference, Day One: CI-PM Integration

I'm at the NAPC Conference in Alexandria, Virginia. Our opening pre-conference session features Allen Lomax from the Community Indicators Consortium talking about their project to integrate community indicators and government performance measures. I'll be participating with a NAPC Forward project to increase the use of social media among community planning agencies, so you'll see more if you follow @N_A_P_C on Twitter (you can follow me, too, at @BenWarner.) You'll see more about the conference also on the NAPC blog and the NAPC YouTube channel.

Allen's presentation is now online at www.communityplanning.org -- excellent examples of communities  trying to engage the community and government around data and the policy implications of using good, shared information. The Community Indicators Consortium is about to put out a call for more Real Stories -- case studies of integration efforts, successful or not -- so watch for that.

The conversation got really interesting, as multiple folk shared their initiatives in their local communities -- the topic appeared to strongly resonate with NAPC members who have been trying to bring community indicators together with performance measures and have important lessons to share. This is a critical connection for this conversation, and I hope more NAPC members get involved in helping this project along.

In other news, you can follow live tweeting of the conference through the #NAPC10 hashtag.

Enjoy!

Read more ...

Tuesday, July 28, 2009

Community Engagement and Civic Indicators

I was reading David Brown's "Citizen-Centered Democracy" interview with Matt Leighninger (of Everyday Democracy and the Deliberative Democracy Consortium) found in Kettering's recent (2009) Higher Education Exchange, and I began thinking about the role and importance of community indicators in both facilitating meaningful civic engagement and in measuring the extent and effectiveness of that engagement.

In the interview, Leighninger (speaking of his book, The Next Form of Democracy) says:

"Different communities will come up with different frameworks for the relationship between citizens and government. But the question of how they know where they are headed, and (perhaps more importantly) how they know they are making progress, is a major challenge for the field. Right now, in most instances, communities and public agencies fail to measure how they are doing with public participation. We need systems that will help people track the quantitative kinds of information -- how many people participated, how diverse and representative they were -- along with more qualitative kinds of data -- what did the participants and the decision makers think of the process, what kinds of tangible changes resulted, and so on. This kind of tracking and measuring ought to be easier now, with all the online technology we have at our disposal, but I haven't yet seen an online system that does all this. Without these kinds of information loops, it is harder for communities to figure out where they are going and how they might get there faster." [emphasis added]

This intrigued me for multiple reasons.

First, I strongly believe that successful community indicators systems must be built on public participation. Absent meaning civic dialogue in determining a shared community vision and consensus in the kinds of information needed to track progress towards that vision, indicators become merely another academic exercise. Community indicators need to be of and from the community, not just for and about the community.

Second, part of our measures of a community ought to include the civic health of the community. How involved are citizens in governance? Are they successful? Do they feel successful? I disagree that counting noses at public meetings is a necessary or even useful indicator, but it is a start. I'd appreciate further conversations that would pick up where the National Civic League's Indicators of Civic Health project left off. To some extent, the current efforts toward bridging community indicators and government performance measures are leading to redefinitions of citizen involvement in community governance, but often in a round-about way -- we probably ought to be more intentional about that conversation and more precise in what we measure.

Third, I suspect that we have some difficulty at times in the field of community indicators bridging community-oriented public dialogue principles and skillsets with data-driven measurement and research capacities -- it's uncomfortable to recognize that we need to bring together both data people and people people in order for our work to make a difference. Balancing the competing needs for data excellence and community conversation (which is often much messier and much less quantifiable) is a challenge that will undermine our work if we're not aware of the tensions and plan our engagement processes accordingly.

I found Leighninger's response to the question of "professionalization" particularly intriguing. (You may remember Ken Jones leading a similar discussion at the 2005 joint Community Indicators Consortium/National Association of Planning Councils conference in Washington, D.C.)

Leighninger said:

"Professionalization is both promising and problematic for us. Right now, there are virtually no barriers to entry in this field -- it seems like all you need to set up shop as an expert on democracy is some free time and a Web site! There's a sort of excitement to that, and it may encourage various kinds of innovation, but at the same time it makes it very difficult for the prospective employers (public managers and other kinds of leaders who need help working more intensively with citizens) to find the right prospective employees (either job candidates for permanent positions, or nonprofits and consultants for temporary projects) who have the right skills and experiences to be effective.

"We need certain aspects of professionalization: a more unified sense of the main principles that undergird the field; stronger degree programs (in disciplines like public administration) that prepare students to engage citizens more productively; and greater awareness of the main organizations, models, and techniques. But we need to retain some antiprofessional qualities as well: the sense that at least some of the basic skills you need to do this work can be learned fairly quickly by committed amateurs without formal training; a shared understanding that your mindset and attitude toward citizens is at least as important as the skills and experiences you bring to the job; and the flexibility to continue adapting models, methods, and principles, so that shared learning is one of the most prized tenets of the field."

I found myself in wholehearted agreement, especially as I considered how this applied to our field of community indicators. I'd appreciate your thoughts and comments on what you think this means to our work.

Read more ...

Friday, April 10, 2009

Data Visualization Presentation for NAPC

I've been getting some grief from folks who want to know why I haven't posted my presentation from the NAPC Conference on Data Displays -- 30 Examples in 30 Minutes. The short answer is that the presentation was a conglomeration of a whole lot of stuff that didn't fit easily into one PowerPoint presentation, and the mishmash of stuff that WAS in my Open-Office-Powerpoint-equivalent-presentation is way too big to e-mail. I tried PDF'ing the whole thing and lost most of the fun interactive portions, and then tried re-creating the whole thing as a movie, but ended up aggravated by the limitations of time and technology to do what I wanted.

Enough of my whining. After the jump are the different examples I showed the group -- the intent was to get a conversation started and people thinking about new ways to tell stories with data, and for those who have been following this blog for a while, nearly everything I shared has been discussed in much greater detail already. I hope you enjoy the overview -- feel free to remind me of all the really cool stuff I left out.

Now click on the link to get the whole presentation. (For any of the images, clicking on them should make them larger and hopefully more readable.)

To get the group moving and a little less scared of talking about data visualization techniques, we began with Sid the Science Kid:


(Go ahead and play the video. This is fun. Dance along if you need to.)

Introduction


When we work with data in communities, we use that data to tell stories and inspire action. Data should make our story-telling more relevant, impactful, truthful, and powerful.

Instead, we take good stories like this one:


And then we use data to turn them into messages like this one, which drains any of the excitement and meaning out of the story:

Spatial relationships among the numbers of items, numbers of characters, and relative sizes mentioned, before Goldilocks encounter

Hans Rosling talks about the importance of good data presentation by showing sheet music from Chopin, and asked if we could tell how beautiful it was. A composer, who specializes in this, can look at the notes and see the beauty. We can't, because all we could see were the notes -- we needed an instrument and someone to play it. Even an electronic keyboard, would help -- they're inexpensive and a child can play them. Too often we get excited about statistics, but all we present to the public are the notes, not the music.


If you haven't seen Dr. Rosling present, go right now to http://www.gapminder.org/ to see him in action. This is his presentation where he talks about Chopin -- it's all in the first minute or so before he introduces GapMinder. You'll also really enjoy this presentation on global development as he uses GapMinder to tell amazing stories.

Nathan Yau says, "Approach data visualization as if you were telling a story. What kind of story are you trying to tell? Is it a report or is it a novel? Do you want to convince people that something is necessary? Think character development. Every data point has a story behind it the same way that every character in a book has a past, present, and future. There are interactions and relationships between those data points. It's up to you to find them."

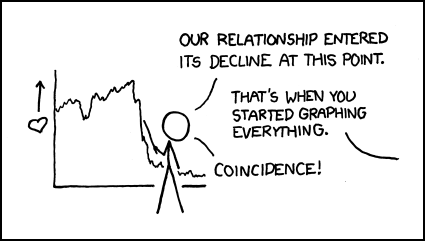
Summary: It's not the data, it's the presentation. Just see what XKCD has to say about it:


So much for the introductory remarks.

Where do we begin?

We start with understanding the type of visualization that matches the kind of information we have and the story we want to tell. Three very good resources are available for us to make those decisions:

(I know I only shared two at the conference, but I meant to show all three and just ran out of time.)
  • www.ChartChooser.com is one approach that brings the template you choose back into Excel for you.
  • Andrew Abela's Flow chart for charts should be printed out and hung above your desk.
  • The Periodic Table of Visualization Methods is more fun than we should be allowed to have on company time. Use your mouse to discover all the options they have for you. The color codes help you determine which of the options fit the data you have and the message you're trying to convey.


There are some really good materials available to help you use your data for advocacy. Tactical Technology Collective has a series of resources, including Visualizing Information for Advocacy (available as a free download) and Maps for Advocacy (ditto) that you should take a look at.

Creating Data Displays Online

You may want to use a number of online tools to share your story. Here are some useful ones you should be aware of:

“Tera Era” - Digital Technology Adoption Is On Rise

Swivel is a fun way to create graphs and share data.

Many Eyes is similar in its approach, with different visualization tools available.


Widgenie adds a little movement when you share graphs online.


And for ease of use and the unusual nature of the "data" presented, nothing beats GraphJam.

Making It Move


This next section looks at how you can tell stories better when you've got the notion to add a little motion. This may not be the approach you want to take with all the stories you have to tell, but for some messages, movement makes the data come alive.

We mentioned GapMinder earlier. Now click this link to see what GapMinder technology can do to tell multi-faceted, time-series stories that hit close to home.

Now check out the emotional impact available when you use data and motion together at So Many a Second.

Twittering the Super Bowl? See what the New York Times did to remind us that data can tell their own stories, if we let them.

A couple of years ago, I shared a motion-based graph from Speculative Bubble at the NAPC conference, to warn us to prepare for the coming real estate collapse. Atari's Roller Coaster Tycoon 3, a game program, was used to create a roller coaster that follows the trend lines and lets you "ride" the graph. Compelling, isn't it? (Hold on to something while you watch this!)


Mapping Worlds lets you choose between the USA and the World for data displays. I like this map of the aging population:


And that should transition us to:

Using Maps To Tell Your Story


The first site I wanted to link to was DataPlace. Right now, it's undergoing site maintenance -- I'll add something more to this when it comes back online -- unless I forget, in which case feel free to remind me to do so.

So go to PolicyMap and poke around -- there's a great deal of free data (registration required, but that's free too) and additional information/tools available for those who subscribe.

Instant Atlas is another mapping software tool -- this one's not free, but the samples are really interesting examples of how to use maps to tell stories with data.

Don't forget Google Earth as a free mapping software tool with opportunities to customize the display with your own data. Google Earth is inspiring a great number of mashups, such as CrashStat 2.0 and EveryBlock -- as great examples of what you can do with data and maps to create messages and transmit information.

I don't think I had time to do more than holler out "Check out GraphWise!" in my presentation. I said a little more about it here when it was first launched. It's not loading right for me today, so fans of GraphWise should remind me to say something more about it when I can get back into the site.

I closed the presentation with a rapid-fire look at some imagines that use graphs and images in ways to make people sit up and notice. I called this section:

Getting Their Attention

Let's start with pie charts:
One pie chart:

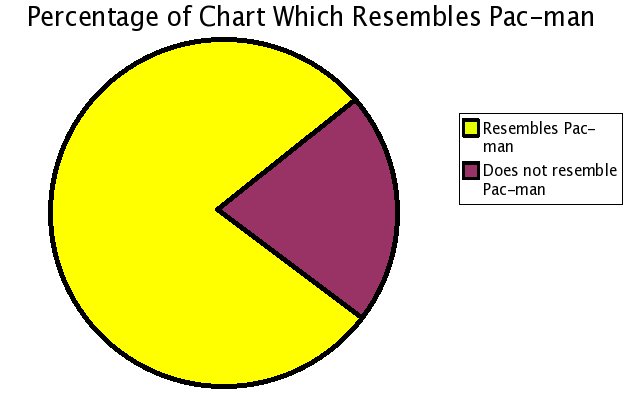
Pacman graph

Pumpkin Pie Chart:


Chocolate Pie Chart:


Pie making you hungry? Check out these obesity statistics:


The challenge we have is to display the data in ways that provoke conversation and promote understanding. I think this chart does that. A similar U.S. map is also available:


There's lots more ideas available at Meryl's Notes Blog with a list of the 175 Top Data Visualization Resources on the Web.

If that's not enough, try this:


Are you still counting to see if I've provided 30 examples of data display techniques in 30 minutes? I'm nearly done. The last section is called:

What About the Big Numbers?


Sometimes we have to tell stories with large numbers. Making those stories come alive poses special challenges.

The MegaPenny Project tries to help large numbers make sense.

Here's another effort to help people visualize large numbers, this time using rice to tell the stories. (Watch the video at the link!)

Let's finish with Chris Jordan, artist and photographer, as he helps us understand the impact we can make with data -- if we can help people visualize the data in ways that speak to their hearts.


I'd love your comments -- what did I leave out?

Read more ...

Friday, March 6, 2009

NAPC Conference: Mariana Salazar

Mariana Salazar, MPA, who is a planner with the Travis County Health and Human Services Community Development Block Grant (CDBG) Program (http://www.co.travis.tx.us/health_human_services/CDBG/default.asp), provided her summary of the National Association of Planning Councils conference. You'll notice immediately that I haven't written about several of the sessions, or anything about the Wednesday meetings that were probably of the most interest to community indicators practitioners. I'll plead guilty -- I was kept too busy during the sessions to blog them, and then my flight to Jacksonville didn't get back until after midnight -- and once I was here, I got caught up in other things. I'll try to add my reflections on the bigger picture of what the Wednesday sessions meant for local researchers, data providers, and community engagement/advocacy fairly soon.

In the meantime, I thought I'd let you see Mariana's notes (she said we could share them.) This group, with its expertise with numbers, will likely figure out that there are only 17 web links on my presentation, and it promised 30 data display options. That's my fault for not providing the links to all of them. I owe you the rest.

Anyway, here's her summary. Drop her a line and thank her.


“Community Planning in Turbulent Times: Staying on Top when the Bottom Falls Out”
National Association of Planning Councils (NAPC)
2009 Conference, Austin, TX, March 2 -4

Conference notes

Making the Census Work for Your Community
Speakers: Representatives from the U.S. Census Bureau
The American Community Survey (ACS), a nationwide survey that collects annual population characteristics and demographic information, is replacing the Census long form that was collected every 10 years.
The Census long form surveyed about 1 out of 6 households (about 16 percent of the total population.) The ACS surveys about 3 million addresses annually, or about 2.2 percent of the population.
The Census long form data was a point-in-time survey while the ACS is a continual survey process. Every month households are surveyed. For annual estimates, twelve months of data are combined. For three or five year estimates, 36-months and 60-months data sets are used.
The ACS has tradeoffs between reliability and timeliness. Comparison of data will require careful understanding of methodology so “apples are compared to apples”
Refer to the ACS Compass Products for educational materials http://www.census.gov/acs/www/UseData/Compass/compass_series.html


Community Planning 101
Speaker: Ben Warner, Jacksonville Community Council (Florida)
Community planning as performed by planning councils is nowadays defined by values more so than a specific organizational structure, collaborative partnerships, funding streams or functional areas.
Visit NAPC’s website to see the values discussed.

“The Perfect Storm” – Community Engagement
Speaker: Phil Dessauer and Jan Figart, Community Service Council in Tulsa, OK
Phil and Jan have identified different forces driving demographic, social and economic changes, drawing attention on the need to plan ahead with those forces in mind.
They identify eight big forces: 1) lack of living wages for the huge population of unskilled/lowskilled persons and the growth in income insecurities, 2) current and growing workforce shortage, 3) rapid aging of the population, 4) growing challenges to assure healthy lifestyles and access to quality health care, 5) continued growing immigration, 6) Rapidly changing environmental conditions, 7) increasing uncertainty on our future supply of energy, and 8) growing challenge to the American culture.
Check out their report and other Perfect Storm presentations on their website
http://www.csctulsa.org/the_perfect_storm.htm
Phil and Jan recommended the book “The Tyranny of Dead Ideas” by Matt Miller.

Drivers of change and what they mean for human services and local communities
Jerry Friedman, American Public Human Services Association.
Human Services is a counter-cyclical business: when times are tough and funding is lowest, the needs are greatest. Tough times are an opportunity for transformation.
We need better measures of poverty.
For more of his ideas visit his blog http://www.aphsa.org/blogs/RUPRI.asp

After the Election...
Discussion on free-ranging topics.
Debate on role of councils – facilitating discussions vs. making sense of data/world, creating spaces of dialogue vs. “telling the news,” can both roles be played effectively?
Planning with a scenario in mind rather than longitudinally
Generational divide in the work force – need for mentoring younger generation and opening spaces for the youth to voice their opinions and be part of the process as part of a succession planning strategy.
Recognizing assets from all age-groups,

The economic Crisis and the way forward
Speaker: Heidi Shierholz, Economic Policy Institute, (Washington, D.C).
Heidi, labor economist, made the following main points: 1) Since 1973, productivity in the U.S. has increased while median wages have not, the result a decline in “good jobs”, 2) poverty has stagnated since 1973, 3) the growth in GDP has gone to the highest 10%, specifically the highest 1%, and over one-third of all wealth generated has gone to the top one-tenth of one percent. By contrast, the bottom 90 percent shared 9.1 percent of the income growth, 4) mobility has declined, 5) health benefits have declined.
A conversation around the current economic crisis needs to start with the ongoing, 35-year decline in middle-class income and poverty that was untouched by national growth in GDP. No trickle down.
Unemployment Right Now
Unemployment/economic downturn hits people differently by race and ethnicity -- much more dramatic increases in unemployment among black and Hispanic workers: In January 2009, unemployment for whites was estimated at 6.9 percent, 9.7 percent for latinos, and 12.6 percent for African Americans.
The current recession has resulted in 5 million job losses, over 11 million unemployed, and the trend lines are still getting worse. These figures do not include the "discouraged worker" who has given up and is no longer actively seeking work.
In January 2009, 22.4 percent of the unemployed has been unemployed for six months or more. In January 2007, there were 1.6 job seekers for every job opening; in December 2008, there were 4.1 job seekers per opening.
Underemployment -- including unemployed, marginally attached workers and the involuntary part-timers -- is 13.9 percent.
So what do we do about it?
The tough and contradictory choice individuals are facing is between increasing savings/paying down debt and increasing spending. Families need to lower debt and increase savings, while the economy needs increased spending.
How long will recovery take? We don't know. Credit crunch recessions tend to be sharp and short-lived; real estate recessions tend to be more mild but take longer to recovery. We have both at the same time; we don't know how long it will take to bring the economy back. Past recessions have taken 25-47 months to get back to peak-level employment. From March 2001 it took nearly 4 years to get back to peak employment. Most likely, working families are in this for the long haul.
Learn more about Heidi’s work and EPI’s readings on the economy on their websitehttp://www.epi.org/economic_snapshots/

Tapping the Mature Workforce—Baby Boomer Retirees Seeking Encore Careers in Nonprofits
Speaker: Martha Blaine, Community Council of Greater Dallas (Dallas, TX)
In the coming years there will be 77 million people reaching the traditional retirement age: NAPCsurvey point 76% of them intend to keep working , 57% of nonprofit EDs are age 50+, 75% of current EDs plan to leave their position by 2011 and nonprofits will need to recruit 640,000 new senior managers
50% of retirees from the for-profit and governmental sectors want jobs in the nonprofit sector. How will nonprofit organizations plan for the expected exodus of current leaders, and train and attract new leaders?
The report “Tapping Encore Talents” from civic ventures explores some of these areas. http://www.civicventures.org/publications/surveys/employerssurvey08/employsurvey_fln_web_oct9.pdf

Developing New Strategies in Bad Economic Times
Speaker: Patrick Linnane, The Planning Council, Milwaukee, WI
Discussion from all participants.
A lot of funders are realigning funding to basic needs leaving non-basic needs non-profits hanging. How can non-profits build reserves during bad times? Entrepreneurial changes needed.
Entrepreneurial changes might mean: getting rid of low-performing initiatives, merging when making sense, lobbying to secure funding, sticking to one’s knowledge base, expanding knowledge strategically, adapting outcomes measurements to reflect the change in funding level, situating the organizations between the different players without duplicating efforts nor competing, combining non-profit work with revenue generating activities.
Non-profit mergers: sometimes they happen out of tragedy. Some mergers make sense while other don’t, they should happen with caution.
The current economic downturn might mask the need to eliminate low performers.
Revenue generating activities: The Dupage Federation on Human Services reform has established a Language Access Resource Center. They offer interpreting services, interpreting training, and translations for fees – all of which help them make money for other aspects of their work.
Planning work should engage business aggressively since they are the ones that create job employment. Council must convince businesses that investing in the communities through partnerships and funding is more than a marketing tool for them – it really impacts welfare of the community as a whole, and the long-term health of workers as both workers and consumers of products.

Increasing Effectiveness in public policy development, research, and analysis
Presenting to Affect Public Policy
Speaker: Dr. Phillip Huang, Austin/ Travis County Health and Human Service Department
Presented the “System Dynamics Modeling” methodology as a new way to use data to affect policy. He is currently using it in the health field. The presentation was specifically about different scenarios with different prevalence of obesity as a result of different combinations of “upstream and downstream” interventions. The methodology allows estimating which intervention is most cost-effective.

Mapping Data to track Indicators, target solutions and maximize impact
Speaker: Jim Walker, Envision Central Texas
Jim presented the Central Texas Sustainability Indicator Project
http://www.centex-indicators.org/index.html
Jim showed maps of socio-economic trends at the neighborhood level in Austin, at the Travis county level, and at a regional level. He recommended planning councils to tap into the resources of universities with graduate students who have mastered GIS mapping skills. “Do not try to learn ArcMap in one day - get a graduate student who can do the job well”

Using CLICKS to chart trends and save time
Speaker: Frances P. Deviney, Center for Public Policy Priorities
Check out the community level information on kids on
http://www.kidscount.org/cgi-bin/cliks.cgi

Mapping Data using accessible, no-cost tools for assessment and planning
Speaker: Sean Moran, Capital Area Council of Government (CAPCOG)
US Census Bureau – Led on the Map = maps showing where workers are employed and where they live : http://lehdmap3.did.census.gov/
Users with Google Earth can view CAPCOG's geospatial data by downloading KMZ files.

Using visual Imagery to describe the world
Speakers: Sunni Brown, BrightSpot Information Design
Sunni displayed ways in which illustrations, graphics recording and digital cartoons are applied for meeting mappings, facilitation, strategic visioning, systems & solutions mapping.
Check out her work at http://sunnibrown.com/

Data Displays – 30 examples in 30 minutes
Speakers: Ben Warner, Jacksonville Community Council
Different ways to display data in an effective and engaging way:

Tactical Technology Collective http://www.tacticaltech.org/
Visual Literacy Periodic Table of Visualization
http://www.visual-literacy.org/periodic_table/periodic_table.html
Many Eyes http://manyeyes.alphaworks.ibm.com/manyeyes/
Graph Jam http://graphjam.com/
Gapminder http://www.gapminder.org/
So Many a Second http://smas.studioludens.com/
Widgenie http://www.widgenie.com/
Swivel http://www.swivel.com/
Mapping Worlds http://www.mappingworlds.com/
Dataplace http://www.dataplace.org/
Policy Maps http://www.policymap.com/
Instant Atlas http://www.instantatlas.com/
Every Block http://www.everyblock.com/
My Apartment Map http://www.myapartmentmap.com/
Chris Jordan http://www.chrisjordan.com/
The Mega Penny Project http://www.kokogiak.com/megapenny/
Infosthetics http://infosthetics.com/

Community Planning in a Digital World: New Methods of Community Engagement Speakers: Taylor Willinghan from Texas Forums, Silona Bonewald, League of Technical Voters
Taylor et all talked about the myriad ways that digital tools can be used for collaborative work.
Social Networks: Twitter and Facebook are effectively being used in the professional realm as tools for civic engagement, organizing, and voluntarism.
Blogs are currently being used as places for hyperlocal news, citizen journalism and placebloggers. Positive news about what is happening in communities are often submitted by unusual suspects. Example of letter submitted by fourth grade students in the Northfield.org Blog http://northfield.org/ . Many blogs are hosting weekly podcast with local news. Blogs as forms of citizen participation might work best in communities that are already civic-minded.
Wikis - present an opportunity for collaborative work. One of the most basic wikis is google.docs.
Other recommended sites:
Mind Mapping Software
Mind Manager
http://www.mindjet.com/
Mind Mapping
http://freemind.sourceforge.net/wiki/index.php/Main_Page
FreeMind (Open Source and free for Windows, Mac and Linux)
Knowbility – Organization focusing on barrier-free IT to support independence of people with disabilities http://www.knowbility.org/main/
Search engine for blogs: http://technorati.com/
Training in Plain Englishhttp://www.commoncraft.com/

Read more ...

Tuesday, March 3, 2009

NAPC Conference: The Economic Crisis, and Ways Forward

Heidi Shierholz, labor economist and co-author of "The State of Working America," addressed the NAPC conference next. She comes from the Economic Policy Institute in Washington, D.C.

Her slideshow presentation will be available shortly. The key points are:

1. Since 1973, productivity in the U.S. has increased. Median wages have not.
2. Poverty has stagnated since 1973.
3. The growth in GDP has gone to the highest 10%, specifically the highest 1%, and over one-third of all wealth generated has gone to the top one-tenth of one percent. By contrast, the bottom 90 percent shared 9.1 percent of the income growth.
4. Mobility declined.
5. Health benefits have declined.

And the economic bad news continues. This suggests that the conversation around the current economic crisis needs to start with the ongoing, 35-year decline in middle-class income and resistant poverty that was untouched by national growth in GDP.

The current recession has us with a 5 million job loss, over 11 million unemployed, and the trend lines still getting worse. And this does not include the "discouraged worker" who has given up and is no longer actively seeking work.

In January 2009, 22.4 percent of the unemployed has been unemployed for six months or more.

In January 2007, there were 1.6 job seekers for every job opening; in December 2008, there were 4.1 job seekers per opening.

Underemployment -- including unemployed, marginally attached workers and the involuntary part-timers -- is 13.9 percent. And unemployment/recession hits people differently by race and ethnicity -- much more dramatic increases in unemployment among black and Hispanic workers.

So what do we do about it?

The Wall Street actions try to get the credit markets flowing so that lenders can lend to businesses that want to expand capacity and people can make big-ticket purchases. The stimulus package intervenes on the demand side through job creation in infrastructure repairs and investments, relief for state governments, consumer supports (such as additional help for the long-term unemployed, food stamps and heating assistance), and tax cuts. (Heidi referenced Mark Zandi and his analysis of the stimulus package.)

The tough choice right now for individuals is between increasing savings/paying down debt and increasing spending. Families need to lower debt and increase savings, while the economy needs increased spending.

How long will recovery take? We don't know. Credit crunch recessions tend to be sharp and short-lived; real estate recessions tend to be more mild but take longer to recovery. We have both at the same time; we don't know how long it will take to bring the economy back. Past recessions have taken 25-47 months to get back to peak-level employment. From March 2001 it took nearly 4 years to get back to peak employment. Most likely, working families are in this for the long haul.

Read more ...

NAPC Conference: Drivers of Change and What They Mean for Human Services and Local Communities


The opening session on Tuesday of the National Association of Planning Councils (NAPC) annual conference was led by Jerry Friedman, executive director of the American Public Human Services Association.

From their website: The American Public Human Services Association, founded in 1930, is a nonprofit, bipartisan organization of state and local human service agencies and individuals who work in or are interested in public human service programs. Our mission is to develop and promote policies and practices that improve the health and well-being of families, children, and adults. We educate Congress, the media, and the general public on social policies and practices and help state and local public human service agencies achieve their desired outcomes in Temporary Assistance for Needy Families, child care, child support, Medicaid, Supplemental Nutrition Assistance Program, child welfare, and other program areas and issues that affect families, the elderly, and people who are economically disadvantaged.

Friedman began: It's said that the key to being a successful human services planner is simply outliving the opposition.

Charles Dickens said, "It was the best of times, it was the worst of times." The same describes today. Human Services is a counter-cyclical business: when times are tough and funding is lowest, the needs are greatest. We in human services have always lacked resources. The job is extraordinarily tough. The goals are so high. Our failures are very visible. We are working to put ourselves out of business. We conduct our business in the open. We make a mistake and it's on the front of the newspaper. We have zero tolerance for failure.

The economy is getting worse and worse. States are in deficit situations. The challenges of child abuse, lack of health insurance, unemployment, and other human needs are huge and are growing.

Our work is cut out for us. We need to be strategic in our approaches to meet these challenges. But I am somewhat optimistic -- this is an opportunity for transformation.

Here is one quick example: The election this last year was a monumental change in this country. I'm very optimistic since I live in a country that would make this kind of change. I remember the civil rights movement, and never thought I would live to see this day.

The APHSA developed a set of policy recommendations for the new administration. The executive summary of their report, "Unity of Purpose: Dignity, Independence, Responsibility," says:

The United States faces its worst economic challenge in decades. APHSA's members, the nation's public health and human service administrators, share the widespread alarm over the difficult circumstances under which so many now suffer. As the nation's experts in helping to alleviate need and promoting the highest possible degree of health and independence, we propose a plan that will:


  • create a health and human service system that moves beyond the dysfunction of the past

  • provide the flexibility necessary for state and local agencies to flourish, yet hold both federal and state health and human service leaders accountable

  • deal realistically and with transparency about budget issues

  • pay for what works, not simply what we can count

We need better measures of poverty. We can't go back to the 1950s to determine economic deprivation. We need to figure out economic safety nets, health care, and federal-state relationships. The report has a series of recommendations on what we need to do. I see out of this administration a willingness to begin the dialogue to make this happen.

The Focal Point document, Unity of Purpose, was met among the membership with a tremendous sense of urgency. We highlighted the things that could be done within 30 days, and many of these items made it into the stimulus package.

We need to focus first on federal and state relations. We need to restore the match rates. We need to frame the issue from a partnership perspective, with flexibility, with options instead of waivers.

The second was health care. First was SCHIP -- and that's now done. We identified 7 regulations that would have been damaging, and there's now a moratorium on them.

Child well-being is a priority. We want reform of the CFSR process -- no state has passed this process, and it's not working as well as being damaging.

Economic supports, such as child support and TANF reauthorization, need work. Reauthorization for TANF comes up in 2010, and it needs significant reform.

We're at a changing time. Technology is changing how we communicate. That is increasing the rapidity of communication, but also decreasing the civility. (Note: Here's Jerry Friedman's blog: http://www.aphsa.org/blogs/SoundsofSilence.asp)

Do what you've always done, but act like you're on steroids. We have a short window with the stimulus package to think and act rationally. We don't have an exit strategy for this. We need to make sure we understand that the resources coming in are temporary and may be gone in 18 months.

Let's rely on what we know works, but do this more rapidly.

Welfare reform was a success -- not just in many of its outcomes, but in how it was developed. We began with a movement, not a law. Over 40 states had tried new ways to meet needs of the people, and the law came after. And we learned some things.


  • We knew that there was a compelling case for change.

  • We learned real change came from the community.

  • We learned that we needed to work together in partnerships.

  • We learned we had to look at the whole person, with all of the problems they faced.

  • We learned that a range of policies were needed in order to be effective.

There's a critical opportunity to lead the nation in making change.


  • First, we need to be clear about policy and planning. They are often different things. Too often, policy is simply compliance. Policy needs to be grounded in operational reality. But we shouldn't be afraid to dream. We have an opportunity for out-of-the-box solutions.

  • Let's be clear about what we're trying to solve. We're not always clear about what success looks like.

  • We need to be data driven. In God we trust; for everything else we need data.

  • We have to create options and big course corrections. We need flexibility, looking at best practices.

  • Let's look at the arguments and be proactive in understanding who won't like the proposed changes -- and why.

  • We need to think holistically. How will all these things impact other systems?

  • We need to be realistic, living within our means and doing what we can afford.

  • We need to get better at sales and marketing. We haven't been really good at getting our message out. We must get better.

  • We need to take advantage of the times. This means making the tough decisions that we were reluctant to make when times were good.

The times are tough, yes. But they're also good. I'm optimistic we can make the changes we need.

Read more ...

NAPC Conference: Community Planning 101

On Monday afternoon, the National Association of Planning Councils held a workshop called Community Planning 101.

Community planning as performed by planning councils is not defined by organizational structure, collaborative partnerships, funding streams, functional areas, topics under discussion, or the kinds of flowcharts you might see in an analytical definition. Especially in today's rapidly-shifting environment when technology, tools, and information are transforming before our eyes.

Instead, something else defines the work.

Peter Stoddard said, "“Planning councils are defined primarily by their agency value structures." 

The NAPC defines those values as follows:

1. Commitment to community and involvement of a broad and diverse constituency
2. Comprehensive perspective reflected in decisions and actions
3. Inclusive decision-making that strives for consensus
4. Diverse viewpoints respected and encouraged in decisions and actions
5. Positive working relationships with all sectors of the community
6. Objective data and information used to support decisions and action
7. Focus on systems change and sustainable, long-term solutions
8. Principled leadership producing measurable results

More information on community planning and planning councils is available at www.communityplanning.org.

Read more ...

NAPC Conference: Preparing for the Impact of Census Changes on Community Planning

The opening session of the National Association of Planning Councils (NAPC) conference was titled "Preparing for the Impact of Census Changes on Community Planning." [Update: Read about the session in this article in the Austin American-Statesman. ] Will Wynn, mayor of Austin, Texas (where the conference is being held), welcomed the 200+ people packed into the Austin City Hall and spoke of the importance of reliable, timely data for good policy and resource allocation. In growing communities like Austin, the need for updated data is even more crucial.

Judge Sam Biscoe, chair of the Capitol Area Council of Governments, said a few words about the importance of the Census products for the 10-county region.

Vanessa Sarria, of the Community Action Network, introduced the program. Ben Warner, president of the NAPC, thanked the audience, the City of Austin, the Community Action Network, and everyone else who put the program together, then got out of the way so that the real conversation could begin.

Susan Schechter, Chief of the American Community Survey (ACS), spoke first. Her powerpoint presentation will be online shortly, and I'll link to it when it is.

The American Community Survey is a nationwide survey that collects population characteristics and housing information every year, replacing the Census long form that was collected only every 10 years. After testing the survey for a few years, in 2005, the ACS expanded to cover in all counties in the 50 states and the District of Columbia (as well as Puerto Rico, where it's called the Puerto Rico Community Survey.) Other U.S. territories (such as Guam) are not covered by the ACS and will still have the Census long form in 2010.

The Census long form surveyed about 1 out of 6 households (about 16 percent of the total population.) The ACS surveys about 3 million addresses annually, or about 2.2 percent of the population. This means that the ACS has some tradeoffs between reliability and currency (timeliness, not money).

The Census long form data was a point-in-time survey. The ACS instead is a continual survey process. Every month households are surveyed. For annual estimates, twelve months of data are combined. For three or five year estimates, 36-month and 60-month data sets are used.

For areas of 65,000 or more, one-year estimates of population characteristics are available. For areas of 20,000 and up, three-year estimates are available. For areas under 20,000 population, the only estimates available are five-year estimates.

In 2006, the ACS sample was expanded to include the population living in group quarters. Group quarters include nursing homes, correctional facilities, military barracks, and college/university housing among others.

In 2008, the first 3-year estimates were released. The first 5-year estimates will be released in 2010.

In 2008, there was also some major changes in the survey, including data about people with disabilities. Data users should pay close attention to the ACS guidelines for how to use the data and which data can be compared to prior years.

Alfredo Navarro, Assistant Division Chief, ACS Statistical Studies, U.S. Census Bureau, spoke next. He provided more technical information on the ACS (his presentation should also be online shortly.) He recommended a series of publications on how to use the ACS, including a new design and methodology report due out in March.

After this overview, Jim Walker, Executive Director of the Central Texas Indicators Project (and a board member of the Community Indicators Consortium introduced the panel charged with discussing the challenges that arise as a result of the Census changes and how community leaders can prepare for those changes. Panelists included:

  • Susan Schechter, Chief, ACS Office
  • Alfredo Navarro, Assistant Division Chief, ACS Statistical Studies
  • Robert Kominski, Assistant Division Chief, Social Characteristics Housing and Household Economic Statistics Division, Census
  • Nicole Scanniello, Coordinator, ACS Organization
  • Karl Eschbach, Texas State Demographer and Director of the Texas State Data Center
  • Ryan Robinson, Demographer, City of Austin
  • Mark Salling, Research Director, The Center for Community Solutions, Cleveland, Ohio
  • Sarah Eckhardt, Travis County Commissioner

The panelists raised some of the challenges faced by data users in transitioning to the new data products. The Census data was predictable and understandable, and had clear information available for small areas. While data users understood there was a margin of error with the information, the margin of error was small and relatively constant, and was effectively ignored by policy makers. It was a single source that could be used by researchers and legislators and communities.

Now there are multiple data products, and data users have choices on which data set to use (if they are looking at a geography of over 65,000 or even over 20,000 population -- under 20,000 has no choices). Choices can bring confusion. The margins of error are necessarily bigger. The one, three, and five-year estimates don't match in a given year (they shouldn't, after all, unless the trend lines were static, but that isn't always intuitive.)

Small-area data and subgroup data are less reliable than in the past, because the sample sizes are smaller. Even five-year estimates will only have a sample size of 11 percent of the housing units, lower than the 16 percent from the Census long form. Other knowledge is often needed to interpret the data.

But there are benefits to the new system, not all of them obvious or just related to timeliness. Instead of temporary census workers distributing the long form and following up, a professional staff of researchers does the work full-time. The reduction in non-sampling errors makes up for the reduced-sampling margin of error. (My translation: the Census long form had bad data in it that we all ignored because it was all we had. Having people collect the data who know what they're doing is a Very Good Thing.) My favorite quote from the session, which I will leave unattributed, was this: "We had census tracts with zero answers to some of the questions on population characteristics, so we imputed the data. "Imputed" means we made it up." (Hasty statement from Someone In Charge: "The Census doesn't say that. The Census has a scientific methodology for careful imputations.")

The ACS has a 97 percent response rate, which is pretty good. We were cautioned, however, not to try to compare 3-year estimates in one area to 1-year estimates in another -- the same level of data should be used consistently. We were also reminded that care should be used in comparing three-year or five-year estimates to the following year's three-year estimates (or five-year.) The difference between the 2005-07 and 2006-08 estimates isn't the change from 2007 to 2008; it's the change between 2005 and 2008.

All in all, a surprisingly enjoyable and incredibly informative session. You should have been there.

Read more ...

Monday, March 2, 2009

NAPC Conference: Keepin' It Weird in Austin, Texas

I'm in Austin, Texas today for the 2009 Conference of the National Association of Planning Councils (NAPC). I'm looking forward to some pretty exciting sessions, and will be sharing some tidbits here as the conference goes along.

I've mentioned NAPC before, but here's a couple of things you ought to know about the organization:

  • Planning councils are in to measuring community indicators in a big way. The Reno conference that launched the Community Indicators Consortium was co-sponsored by NAPC, and they have held joint conferences with CIC to help share the importance of measuring trends at the local level.
  • Planning councils are action-oriented kinds of organizations. They use information to inform policy, shape decision-making, implement programs, and make life better for people in the communities they serve.
  • Planning councils are struggling. People (governments, philanthropic organizations, individuals) like to fund direct service. Big-picture stuff is a harder sell -- but it's the big picture that makes the direct service work work. Figuring out what needs doing, what's working, what's not working, and where the resources need to be targeted is even more critical in times of resource scarcity.

OK, I'm off my soapbox now. If you're working for a planning council, good for you. If not, go support your local planning council. And if your community no longer has one -- if budget crunches and active neglect has forced the planning council to close its doors or morph into just a direct service organization -- now would be a really good time to try to bring it back.

Read more ...

Thursday, January 22, 2009

NAPC Conference: Go to this one!


Let's begin with full disclosure: I'm currently serving as president of the National Association of Planning Councils (NAPC). And so my motives for encouraging people to attend their March 2009 conference are necessarily influenced by that role.

That being said, this promises to be a hum-dinger of a conference. Titled "Community Planning in Turbulent Times--Staying on Top when the Bottom Falls Out," the conference builds on the work of last year's Global Trends, Local Impacts conference to examine trends, see how they impact us, and figure out what to do about them. Plus there's going to be a heckuva fun discussion of technology and community work -- how to use 21st century tools to address 21st century problems.

Austin, Texas. March 2-4, 2009. Make plans to attend! (More conference description after the break.)

Here's a better (more official) description of the conference:

Today we face a world that is rapidly changing. Global and national trends are reshaping what problems we face, how we face them, and who faces them. Our country's leadership is in transition. Today we need to come together as an Association of people and organizations who care deeply about our communities and are engaged in planning for the future well-being of the people we serve. We need to understand the global economic, demographic, technological, social, and other trends that affect us. We need to know how best to address these trends in ways that make life better for all in our communities. And we need to develop the flexibility and skills to be able to think in new ways and use new tools to assure that our own organizations will survive and thrive, so we can continue to lead and support community progress in the challenging times to come.


Conference outcomes...participants will:

  • Gain vital information and will understand effective community change models they can apply to their own community issues

  • Be inspired and have the tools to implement practices they have learned and created when they return home

  • Have opportunities to interact with their peers, gain new insights into successful community change strategies, and expand their network of professional colleagues

  • Understand the criticality and essential nature of community change work

  • Know that their time is well spent/cost effective...and have fun

The conference will include:

  • Three nationally-known keynote speakers, plus leading community planning practitioners and technology experts from across the U.S.

  • Newcomers' welcome session

  • Opening reception, the evening of Monday, March 2

  • Three days of speakers and interactive sessions: March 2, 3, and 4
    (breakfasts and lunches are included on March 3 and 4)

  • Resource fair…bring your materials

  • Judith Rothbaum Award, honoring excellence in using data for community action

  • National Association of Planning Councils annual meeting

You really need to go to this one. If you have any questions about the conference, let me know.

Read more ...