Community Indicators for Your Community

Real, lasting community change is built around knowing where you are, where you want to be, and whether your efforts are making a difference. Indicators are a necessary ingredient for sustainable change. And the process of selecting community indicators -- who chooses, how they choose, what they choose -- is as important as the data you select.

This is an archive of thoughts I had about indicators and the community indicators movement. Some of the thinking is outdated, and many of the links may have broken over time.

Friday, April 10, 2009

Data Visualization Presentation for NAPC

I've been getting some grief from folks who want to know why I haven't posted my presentation from the NAPC Conference on Data Displays -- 30 Examples in 30 Minutes. The short answer is that the presentation was a conglomeration of a whole lot of stuff that didn't fit easily into one PowerPoint presentation, and the mishmash of stuff that WAS in my Open-Office-Powerpoint-equivalent-presentation is way too big to e-mail. I tried PDF'ing the whole thing and lost most of the fun interactive portions, and then tried re-creating the whole thing as a movie, but ended up aggravated by the limitations of time and technology to do what I wanted.

Enough of my whining. After the jump are the different examples I showed the group -- the intent was to get a conversation started and people thinking about new ways to tell stories with data, and for those who have been following this blog for a while, nearly everything I shared has been discussed in much greater detail already. I hope you enjoy the overview -- feel free to remind me of all the really cool stuff I left out.

Now click on the link to get the whole presentation. (For any of the images, clicking on them should make them larger and hopefully more readable.)

To get the group moving and a little less scared of talking about data visualization techniques, we began with Sid the Science Kid:


(Go ahead and play the video. This is fun. Dance along if you need to.)

Introduction


When we work with data in communities, we use that data to tell stories and inspire action. Data should make our story-telling more relevant, impactful, truthful, and powerful.

Instead, we take good stories like this one:


And then we use data to turn them into messages like this one, which drains any of the excitement and meaning out of the story:

Spatial relationships among the numbers of items, numbers of characters, and relative sizes mentioned, before Goldilocks encounter

Hans Rosling talks about the importance of good data presentation by showing sheet music from Chopin, and asked if we could tell how beautiful it was. A composer, who specializes in this, can look at the notes and see the beauty. We can't, because all we could see were the notes -- we needed an instrument and someone to play it. Even an electronic keyboard, would help -- they're inexpensive and a child can play them. Too often we get excited about statistics, but all we present to the public are the notes, not the music.


If you haven't seen Dr. Rosling present, go right now to http://www.gapminder.org/ to see him in action. This is his presentation where he talks about Chopin -- it's all in the first minute or so before he introduces GapMinder. You'll also really enjoy this presentation on global development as he uses GapMinder to tell amazing stories.

Nathan Yau says, "Approach data visualization as if you were telling a story. What kind of story are you trying to tell? Is it a report or is it a novel? Do you want to convince people that something is necessary? Think character development. Every data point has a story behind it the same way that every character in a book has a past, present, and future. There are interactions and relationships between those data points. It's up to you to find them."

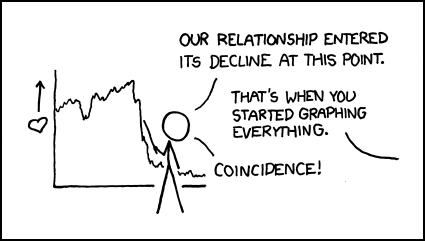
Summary: It's not the data, it's the presentation. Just see what XKCD has to say about it:


So much for the introductory remarks.

Where do we begin?

We start with understanding the type of visualization that matches the kind of information we have and the story we want to tell. Three very good resources are available for us to make those decisions:

(I know I only shared two at the conference, but I meant to show all three and just ran out of time.)
  • www.ChartChooser.com is one approach that brings the template you choose back into Excel for you.
  • Andrew Abela's Flow chart for charts should be printed out and hung above your desk.
  • The Periodic Table of Visualization Methods is more fun than we should be allowed to have on company time. Use your mouse to discover all the options they have for you. The color codes help you determine which of the options fit the data you have and the message you're trying to convey.


There are some really good materials available to help you use your data for advocacy. Tactical Technology Collective has a series of resources, including Visualizing Information for Advocacy (available as a free download) and Maps for Advocacy (ditto) that you should take a look at.

Creating Data Displays Online

You may want to use a number of online tools to share your story. Here are some useful ones you should be aware of:

“Tera Era” - Digital Technology Adoption Is On Rise

Swivel is a fun way to create graphs and share data.

Many Eyes is similar in its approach, with different visualization tools available.


Widgenie adds a little movement when you share graphs online.


And for ease of use and the unusual nature of the "data" presented, nothing beats GraphJam.

Making It Move


This next section looks at how you can tell stories better when you've got the notion to add a little motion. This may not be the approach you want to take with all the stories you have to tell, but for some messages, movement makes the data come alive.

We mentioned GapMinder earlier. Now click this link to see what GapMinder technology can do to tell multi-faceted, time-series stories that hit close to home.

Now check out the emotional impact available when you use data and motion together at So Many a Second.

Twittering the Super Bowl? See what the New York Times did to remind us that data can tell their own stories, if we let them.

A couple of years ago, I shared a motion-based graph from Speculative Bubble at the NAPC conference, to warn us to prepare for the coming real estate collapse. Atari's Roller Coaster Tycoon 3, a game program, was used to create a roller coaster that follows the trend lines and lets you "ride" the graph. Compelling, isn't it? (Hold on to something while you watch this!)


Mapping Worlds lets you choose between the USA and the World for data displays. I like this map of the aging population:


And that should transition us to:

Using Maps To Tell Your Story


The first site I wanted to link to was DataPlace. Right now, it's undergoing site maintenance -- I'll add something more to this when it comes back online -- unless I forget, in which case feel free to remind me to do so.

So go to PolicyMap and poke around -- there's a great deal of free data (registration required, but that's free too) and additional information/tools available for those who subscribe.

Instant Atlas is another mapping software tool -- this one's not free, but the samples are really interesting examples of how to use maps to tell stories with data.

Don't forget Google Earth as a free mapping software tool with opportunities to customize the display with your own data. Google Earth is inspiring a great number of mashups, such as CrashStat 2.0 and EveryBlock -- as great examples of what you can do with data and maps to create messages and transmit information.

I don't think I had time to do more than holler out "Check out GraphWise!" in my presentation. I said a little more about it here when it was first launched. It's not loading right for me today, so fans of GraphWise should remind me to say something more about it when I can get back into the site.

I closed the presentation with a rapid-fire look at some imagines that use graphs and images in ways to make people sit up and notice. I called this section:

Getting Their Attention

Let's start with pie charts:
One pie chart:
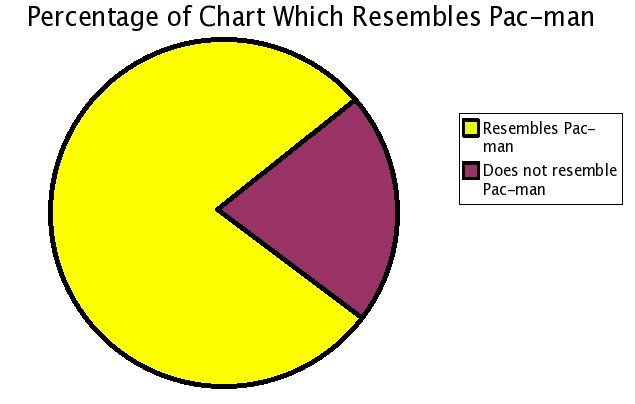
Pacman graph

Pumpkin Pie Chart:


Chocolate Pie Chart:


Pie making you hungry? Check out these obesity statistics:


The challenge we have is to display the data in ways that provoke conversation and promote understanding. I think this chart does that. A similar U.S. map is also available:


There's lots more ideas available at Meryl's Notes Blog with a list of the 175 Top Data Visualization Resources on the Web.

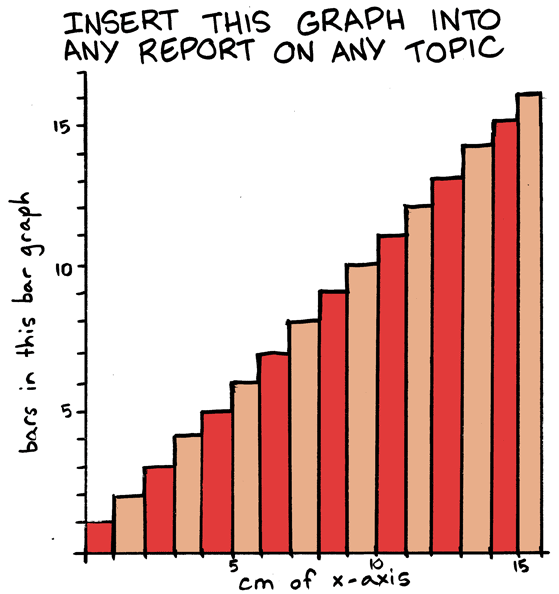
If that's not enough, try this:


Are you still counting to see if I've provided 30 examples of data display techniques in 30 minutes? I'm nearly done. The last section is called:

What About the Big Numbers?


Sometimes we have to tell stories with large numbers. Making those stories come alive poses special challenges.

The MegaPenny Project tries to help large numbers make sense.

Here's another effort to help people visualize large numbers, this time using rice to tell the stories. (Watch the video at the link!)

Let's finish with Chris Jordan, artist and photographer, as he helps us understand the impact we can make with data -- if we can help people visualize the data in ways that speak to their hearts.


I'd love your comments -- what did I leave out?

Read more ...

Thursday, April 9, 2009

Transparency and Open Government Newsletter

This has been tweeted and retweeted a number of times in the past hour, and just in case you missed it, I thought I'd pass it on. The CitizenServices.Gov site (which you may know as USASerivces.Gov, the Citizen Services Network E-Government initiative led by the General Services Administration’s Office of Citizen Services) has launched its new newsletter -- and it's a must-read for community indicators practitioners.

The Transparency and Open Government Newsletter (PDF) includes a number of items of interest in its 40 pages:

President Obama's Memorandum for the Heads of Executive Departments and Agencies

A section on Democratization of Data including articles such as:

  • Unfettered Access to Data Can Transform Government?
  • Technology as a Game-Changer
  • Information as a Public Good
  • Citizen Views On Transparency
Another section on Practices at Work in Government, including:
  • Texas Websites Improve Accountability
  • Georgia’s Commitment to Customer Service and Good Government
  • Transparency 2.0
  • Measuring E-Government 2.0
  • E-discovery, Transparency and Culture Change
  • AGA Opens the Doors of Government to the Citizens
And much more, including:
  • Through a Glass, Darkly. What do we mean by transparency in government?
  • Transparency in Government Begins Outside
  • The Collaborative Government: Beyond Transparency in Government
  • Get Ready for Wiki-Government
  • Building the Digital Public Square
  • Open Government Serves Citizens
Whether you use government data in a government performance benchmarking report, community indicators system, or some of both, you need to be paying attention to how the rules are changing in how data flow from the government to you. The same models for data distribution at the federal level, including the assumption that the information is public unless otherwise restricted (instead of the assumption that information is restricted unless pronounced available), can be encouraged at the state and local levels.

Read the newsletter and let me know what you think.

Read more ...

Wednesday, April 8, 2009

Funding Community Indicators Projects

We briefly touched on the problem of funding community indicators projects last year when a news article reminded us of the difficulty in obtaining and maintaining financial partners for this work.

Here's a recent example of the tough time some folks are having in securing funding for their indicators projects. The line I cringed at what this one: "The mayor noted that usually such projects get DECREASING amounts of money from year to year, lest they become a permanent burden on the budget."

I suspect that, especially in this economic climate, many of us are thinking about the financial sustainability of our community indicators efforts. We know that even talking about data can make people less likely to open their wallets.

Our organization has been publishing a community indicators report annually since 1985. We've seen a number of shifts in funding patterns in the community, but have managed to maintain funding for indicators (even when every other project we do has taken hits.) I'd be interested to hear from you, the readers, if it would make sense to begin a conversation among ourselves about challenges and effective strategies in funding community indicators projects. All those interested in joining that conversation, please make your interest known by replying to this message.

Thanks!

Read more ...

New Issue of Social Indicators Research Available

Just a quick news flash:

The latest issue of Social Indicators Research has just been released, and you can browse the Table of Contents and abstracts of each article here.

For those unfamiliar with this journal, it's worth taking a good long look. Alex Michalos is the editor, and he's amazingly knowledgeable about what's happening in the field. Not all of the articles are pertinent to community-level indicators work, but it helps you stay on top of what the research is saying about measurements that matter. If you don't currently subscribe, go here for a description of the series, links to articles, and an opportunity to request a free issue.

Read more ...

Tuesday, April 7, 2009

OECD Regional Statistics

I've been poking around on a fun site from the good folks at OECD, and liking what I'm finding. The site is called OECD Regional Statistics, and it's off to a pretty good start.

The site opens with maps of the world, focused down to a country/state level. The focus is not on nations, however, but on smaller geographies -- I could scale down to my metro region fairly rapidly. (see tabs for "Large Regions" and "Small Regions.") And I could then compare my metro with other similarly-sized geographies on a global basis.

There's some interesting information there, mostly demographic and labor market information. What's really interesting is that it's organized by "stories," which they describe as "Stories load some indicators into the graphs to the left and explain what you see." They also provide opportunities to load in other stories and/or indicators, either from their data sets or you can load your own.

I was stumbling around looking for some information about the data when I finally figured out to mouseover the "i" icons for information. This gave me the description of the indicator and the year measured. More information is presumably available at OECD Stat.Extracts, but I found it a little intimidating to try to match the data I was looking at to the data in their collection. It ought to be easier to discover the source of the data!

All in all, though, it's an exciting beginning to use GapMinder-style displays to examine intersections of data in 2 or 3 dimensions across sub-national regions. I highly recommend trying out the site and seeing the insights it might give you about your community and its relative place among similar communities in the world.

I'd enjoy hearing from you about your experiences with this site.

(Also check out this nice article from information aesthetics about the site.)

Read more ...

Monday, April 6, 2009

Problems with Geocoding

Here's an interesting problem with mapping crime statistics:

CNet reports that a new online crime mapping tool in Los Angeles shows a huge crime wave right next to the new police headquarters building. The problem turns out to be the default for addresses of crimes.

We had the same problem in Jacksonville when looking at prostitution statistics -- the most "popular" street corner for the trade appeared to be within police headquarters. Again, it was a data coding error -- blank address fields defaulted to police headquarters.

Our experience (and now this story from LA) is a reminder that our data systems are only as good as our inputs, and as we start using data in new and creative ways, we are bound to uncover all kinds of errors that will need to be addressed properly. (Pun only kind of intended.)

Have you seen similar issues in your community?

(Hat tip: Slashdot)

Read more ...

Trulia Hindsight

I was watching a couple of videos from Eric Rodenbeck that information aesthetics had posted on their blog, and he referenced the work they're doing with Trulia Hindsight. So I wandered over to play with this mapping tool.

Here's what you can do: Go to your city (within the United States), and zoom in to the level you're interested in. (It's Microsoft Virtual Earth based, which isn't as easy to navigate as Google Earth, but it's not too hard -- I just keep ending up in the Atlantic Ocean if I zoom in too far without centering in on my city first.)

Now watch the time-series map display housing construction by year, and see visually the housing patterns in your community over the last 100+ years. Pretty amazing, isn't it?

I enjoyed checking on the development patterns of different cities in the U.S. and comparing how they grew, and at what rates.

I don't know how to integrate this kind of visualization into a local community indicators project as yet ... I'd be interested in your thoughts. But it was fascinating to watch anyway.

Let me know what you think.

Read more ...

Data.gov Coming!

From Slashdot yesterday:

"In late May, Data.gov will launch, in what US CIO Vivek Kundra calls an attempt to ensure that all government data 'that is not restricted for national security reasons can be made public' through data feeds. This appears to be a tremendous expansion on (and an official form of) third-party products like the Sunlight Labs API. Of course, it is still a far cry from 'open sourcing' the actual decision-making processes of government. Wired has launched a wiki for calling attention to datasets that should be shared as part of the Data.gov plan, and an article on O'Reilly discusses the importance of making this information easily accessible."

You can follow the discussion here. This looks really interesting.

Read more ...

Friday, April 3, 2009

Magnet States, Sticky States, and Population Flows

At the 2008 NAPC Annual Conference demographer Harold Hodgkinson spoke about the transience of the American population (over 40 million people move every year, a pattern he finds "pathological".) In all that moving around, some states are losers, and some are winners (and some lose by winning too much, but that's another discussing about managing growth impacts.)

The Pew Research Center has provided some useful language to describe two separate factors related to population movements within the United States. After analyzing population data, they provide these definitions:

  • "Magnet" states are those in which a high share of the adults who live there now moved there from some other state.
  • "Sticky" states are those in which a high share of the adults who were born there live there now.
Data are derived from American Community Survey Integrated Public Use Microdata Series, 2005-2007. Only U.S.-born adults, ages 18 and older, living in the United States are included in these tabulations.
  • Magnet states are calculated by: Residents born out of a state / Total state population.
  • Sticky states are calculated by: Residents born in a state and living in the same state /Residents born in the state and living in the United States.
A list of each state and its "magnet" and "sticky" numbers can be found here.

Some states are magnets but not sticky; some are sticky but not magnets; some are sticky magnets; and some are neither sticky nor magnetic. (and a few states defy classification -- I'm talking about you, Oklahoma!)

They also provide maps for regional and interstate migration patterns why are fun to play with.

Why is this important? Dr. Hodgkinson says:

Hundreds of studies examine why people leave places, but few ask why people stay. Yet this is enormously important.

Transience destroys communities. Communities need engaged churches that care about the larger community as well as their own members. Communities need small retail stores with places to hang out, sit down and gossip (if you can't sit down, you can't truly gossip). And they need active associations. Writing a check to the Boy Scouts is not enough; communities need troop leaders. Communities also need diverse economies with small manufacturing companies where even high school graduates can earn enough to own homes in the community. High home ownership rates, in turn, offer further stability, even in big-city neighborhoods.

Families with children are important in a community, too. And if the children are known by adults who are not their parents, that's pure gold. If somebody who is not a parent can say, "Johnny, you better stop doing that or I'm going to tell your mother," Johnny stops doing that. It's one of the world's great surveillance systems, but it only works for adults who know children by name.

A few people have picked up on the research, but few of those have begun the discussions about the implications. For those of us working on community indicators and civic engagement, we've struggled with these issues for some time. How can a community improve its quality of life for the benefit of its residents? How can the people living in a community come together to identify a shared vision of what's important? How can those values and dreams be measured to know if we are progressing towards a desired future?

In community groups all over the country, I've heard residents concerned that they retain a sense of place and the unique nature of the community that they grew up with (or that attracted them so much when they moved to that location.) I've heard parents worry that their home community provide opportunities to encourage (or even allow) their children to desire to live there as adults.

On the other hand, I've seen communities struggle to find a sense of identity when the majority of people living there have been there for 10 years or less. I've watched communities battle in local government and in the media over competing views for the future -- maintaining the kind of place long-time residents are comfortable with, or embracing a new future similar to the kinds of places new residents remember fondly.

So add these words -- "magnet" and "sticky" -- to your vocabulary for community work. I'd be interested in your input on how these population changes affect your work -- I think of the conversation we just had in Austin among communities with population growth and others with population losses, and the challenges they each face.

Your thoughts?

(Hat tip: SCOPE)

Read more ...

Thursday, April 2, 2009

AGA's Perspectives on Performance April 2009 Newsletter Released

The Association of Government Accountants (AGA) just sent out their April 2009 Newsletter. There's a great deal of important information for us in the newsletter, so I highly encourage you to take a look -- see how the Sloan foundation is winding down its support for performance measurement initiatives, what's happening at the Public Performance Measurement and Reporting Network, and more information about citizen-centric reporting and SEA reports.

Why are you still reading this? Go see their newsletter!

Read more ...

Wednesday, April 1, 2009

The State of Black America 2009

Many of you know I'm heavily involved with Jacksonville's annual Race Relations Progress Report. A critical component of community indicators, in my opinion, is understanding the disparities and disproportionalities in those indicators -- measuring the progress of a community means understanding how that progress is distributed among members of that community.

That's why I always look forward to the release of the next State of Black America report by the National Urban League.

The report is garnering more attention this year, with the results of last November's presidential election providing a critical context to understanding the conversation around race and opportunity in the United States. That may be why this year's report is subtitled "A Message to the President."

Leonard Pitts, a Pulitzer-prize-winning columnist at the Miami Herald, offered some insights into the challenges of measuring racial progress. In this CNN commentary, Pitts explains:

Psychology professor Richard Eibach was reported last year in the Washington Post as having found that in judging racial progress, white people and black ones tend to use different yardsticks. Whites use the yardstick of how far we have come from the nation we used to be. Blacks use the yardstick of how far we have yet to go to be the nation we ought to be.

The most complete picture, of course, requires both measures. But who can be surprised that blacks and whites each tend to gravitate toward the measure that is most forgiving of their individual groups, that shoves the onus for change off on the other? The black yardstick, after all, leaves black people no obligation other than to demand justice and equality from white people. The white yardstick requires of white people only that they exhort black people to become more self-reliant and take more responsibility for their own problems.

Pitt goes on to explain why we need to measure using both yardsticks, and praises the National Urban League for doing so.

The bigger idea of thinking about how we measure -- what our "yardstick" is -- is an important one for any of our indicator systems. It's more than thinking about what our goals/targets might be, but whether we should measure toward a goal or from a baseline. It raises questions about how we describe the data -- are we better than we used to be or not where we ought to be?

I like the questions raised. I also like the National Urban League's annual report. Check it out and let me know what you think.

ETA: Check out this op-ed piece for an example of conflicting yardsticks.

ETA2: Also see this discussion of why measuring race matters.

Read more ...